CytoBridge:
CytoBridge is a Python package designed to provide a unified and extensible framework for modeling cellular dynamics using Spatiotemporal Dynamical Generative Models. Our goal is to connect cutting-edge theoretical frameworks with practical, easy-to-use tools.
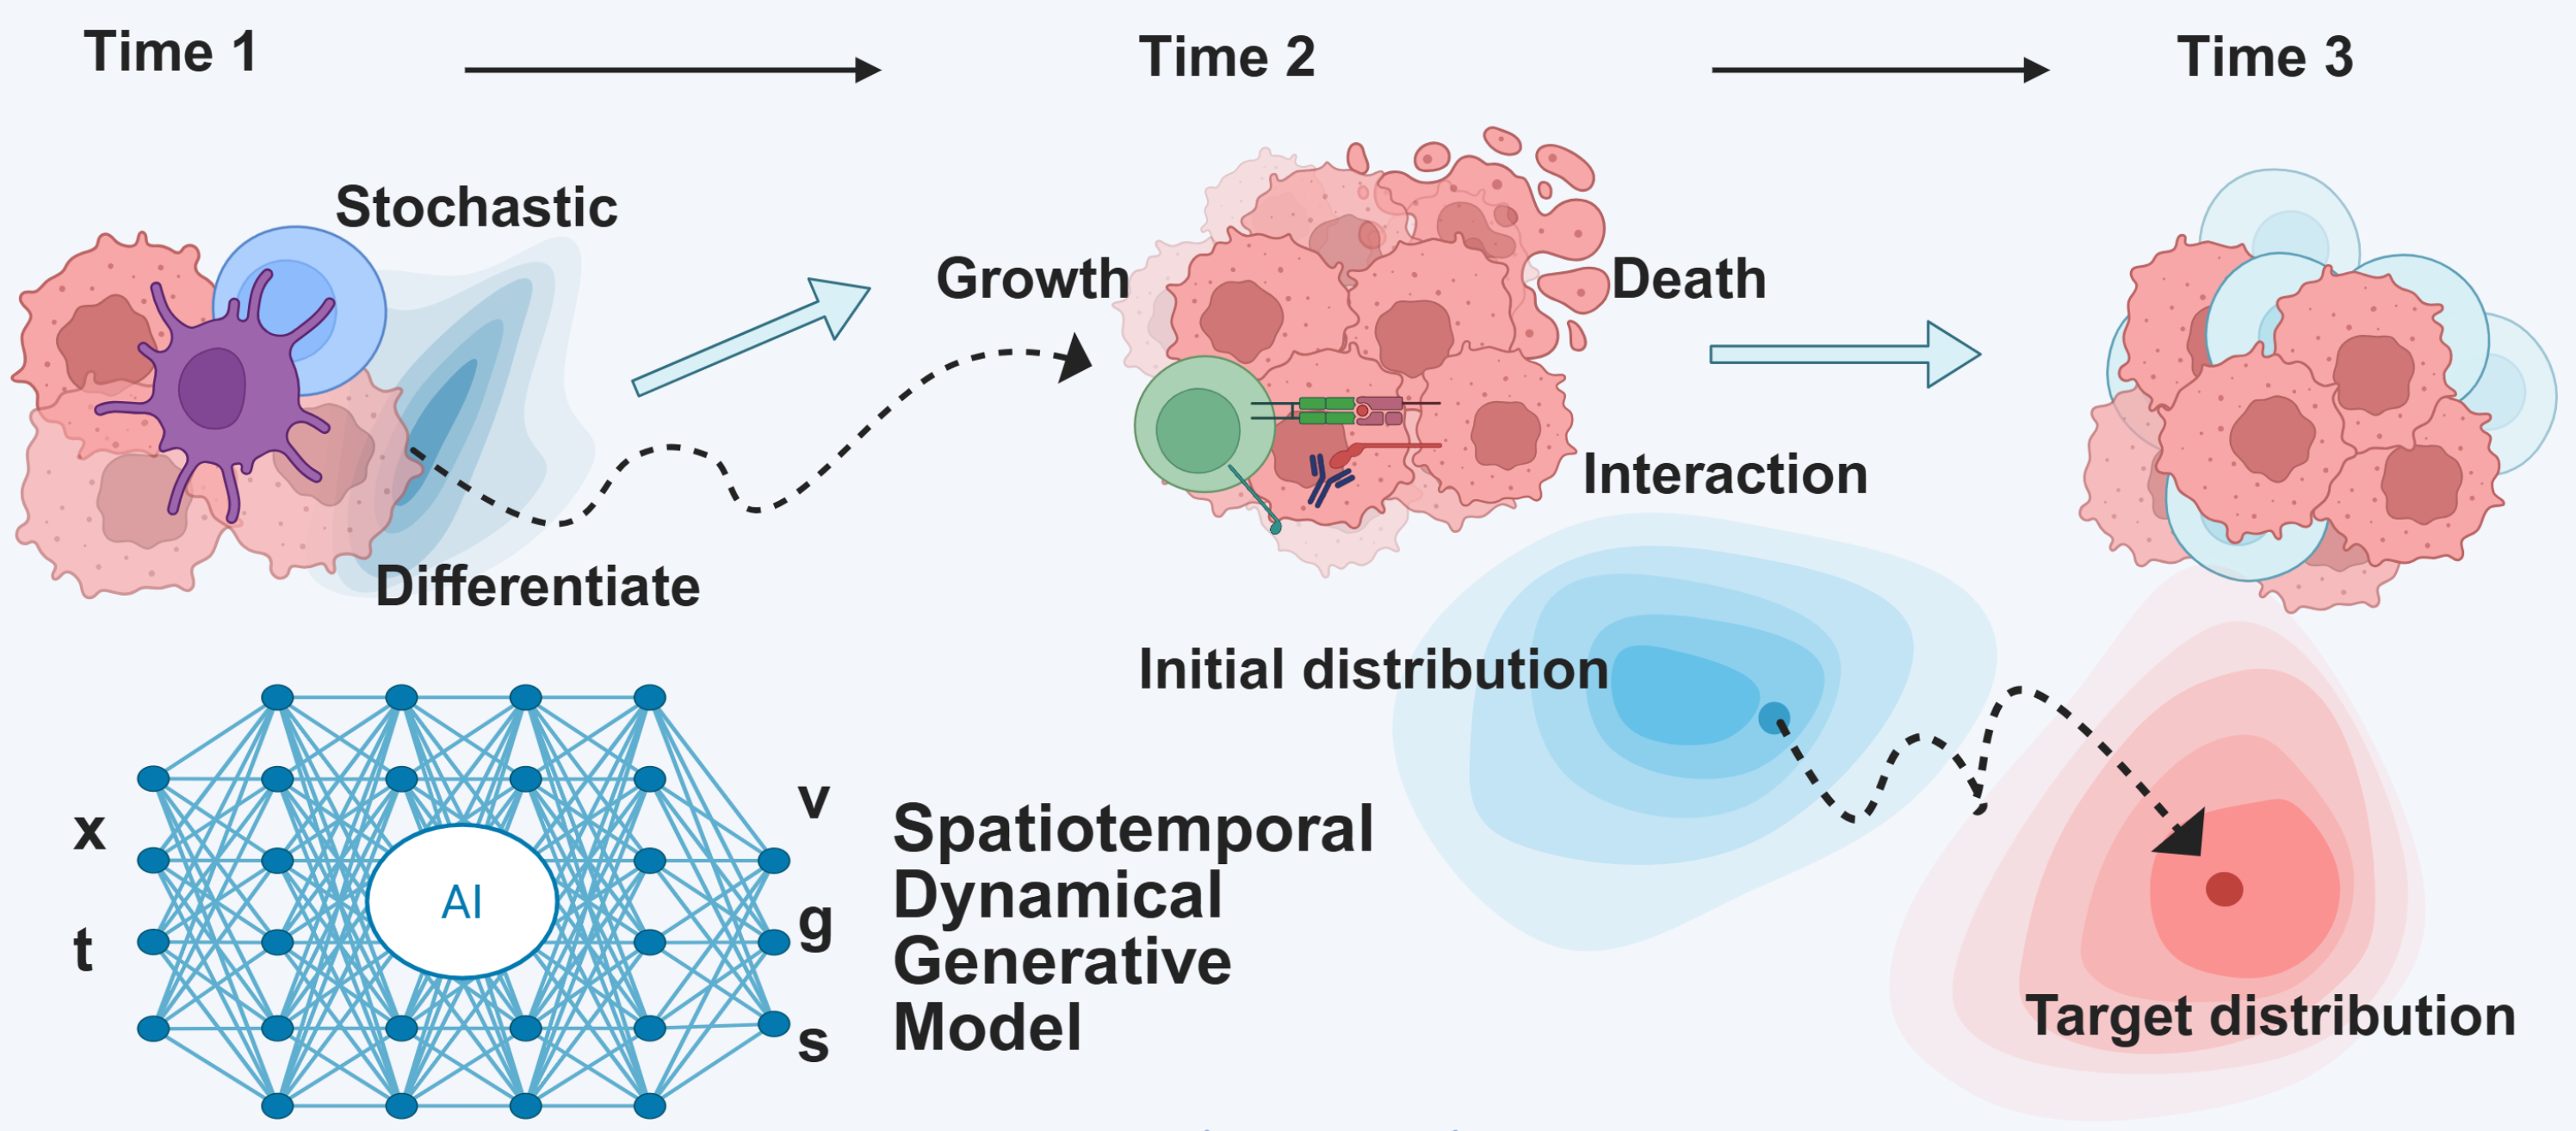
The core of CytoBridge is to model cellular processes by learning a dynamical model that accounts for various biological phenomena using time-series transcriptomics data (including both scRNA-seq and spatial data):
Velocity — instantaneous direction of cell state transitions (Corresponds to Dynamical OT)
Growth — proliferation and apoptosis rates (Corresponds to Unbalanced OT, UOT)
Score (Planned) — diffusion/noise term modeling stochasticity (Corresponds to Regularized Unbalanced OT)
Interaction (Planned) — cell–cell communication influences (Corresponds to Unbalanced Mean Field Schrödinger Bridge)
The package is built to be modular, allowing users to easily combine these components to replicate existing models or create novel ones.
Current Status
CytoBridge is currently under active development. The foundational framework is in place, and we have implemented the following models:
Dynamical OT (velocity)
Unbalanced Dynamical OT (velocity + growth)
Regularized Unbalanced OT (RUOT) (velocity + growth + stochasticity)
Conditional RegularizedOT Unbalanced Flow Matching (CRUFM) (velocity + growth + stochasticity)
cytobridge (velocity + growth + stochasticity + interaction)
Roadmap
We are continuously working to expand the capabilities of CytoBridge. Our development plan is as follows:
- [√] Phase 1: Stochastic Dynamics & RUOT
[√] Implementation of the
scorecomponent to model stochasticity.[√] Support for training methods based on the Regularized Unbalanced Optimal Transport (RUOT) frameworks.
[√] Integration of simulation-free training methods (e.g., Conditional Flow Matching, Velocity-growth Flow Matching).
[√] Basic plotting functions and downstream analysis.
- [√] Phase 2: Advanced Modeling & Downstream Analysis
[√] Implementation of the
interactioncomponent for modeling cell-cell communication.[√] Advanced plotting functions and downstream analysis.
- [ ] Phase 3: Spatiotemporal Dynamics
[ ] Support for time serise spatial transcriptomics data.
[ ] Advanced plotting functions and downstream analysis.
Here’s a polished and reorganized version of your installation and usage instructions, with improved clarity and flow: