Mouse Blood Hematopoiesis + Basic Plot
Note: The results presented are derived from real data with cell-type annotations, utilizing components of Velocity, Growth, and Score.
import pandas as pd
import scanpy as sc
import numpy as np
from anndata import AnnData
import os
import CytoBridge as cb
1. Load Trained Data and Model
Load the trained data from the specified H5AD file and load the associated model.
save_path = "/home/sjt/workspace2/CytoBridge_test-main_crufm/results/results_cluster/adata.h5ad"
exp_name      = os.path.basename(os.path.dirname(save_path))      # -> results_unscore
base_fig_dir  = "/home/sjt/workspace2/CytoBridge_test-main_crufm/figures"
output_path   = os.path.join(base_fig_dir, exp_name)
os.makedirs(output_path, exist_ok=True)


adata  = sc.read_h5ad(save_path)
model  = cb.utils.load_model_from_adata(adata)
device = "cuda"
print(adata)
Reconstructing model...
Model loaded successfully.
AnnData object with n_obs × n_vars = 49116 × 40
    obs: 'samples', 'cluster', 'time_point_processed', 'velocity_self_transition', 'time_categorical'
    uns: 'all_model', 'neighbors', 'time_categorical_colors', 'velocity_graph', 'velocity_graph_neg', 'velocity_params'
    obsm: 'X_latent', 'X_umap', 'growth_rate', 'score_latent', 'velocity_latent', 'velocity_umap'
    layers: 'Ms', 'velocity', 'velocity_latent'
    obsp: 'connectivities', 'distances'
2.Dissecting Learned Dynamics on Observed Data
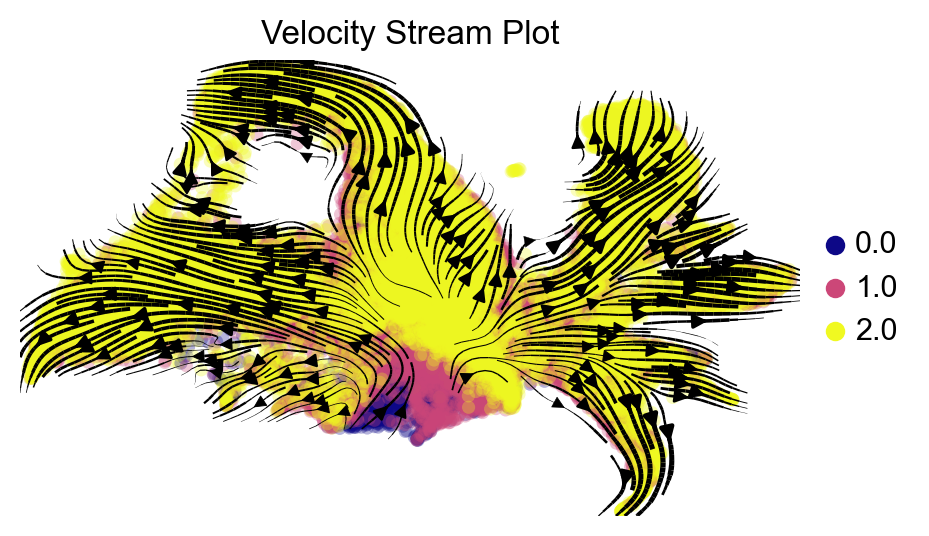
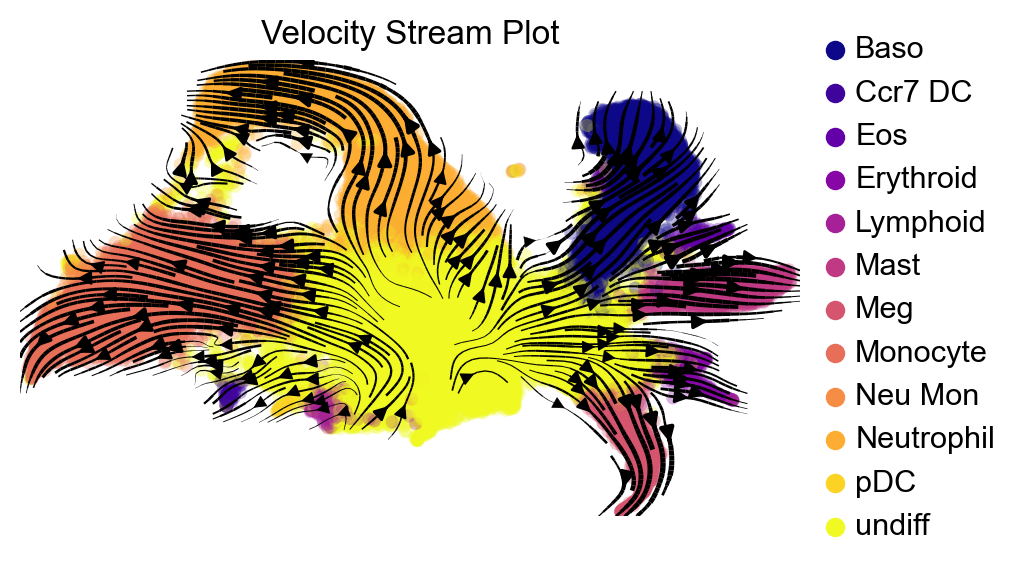
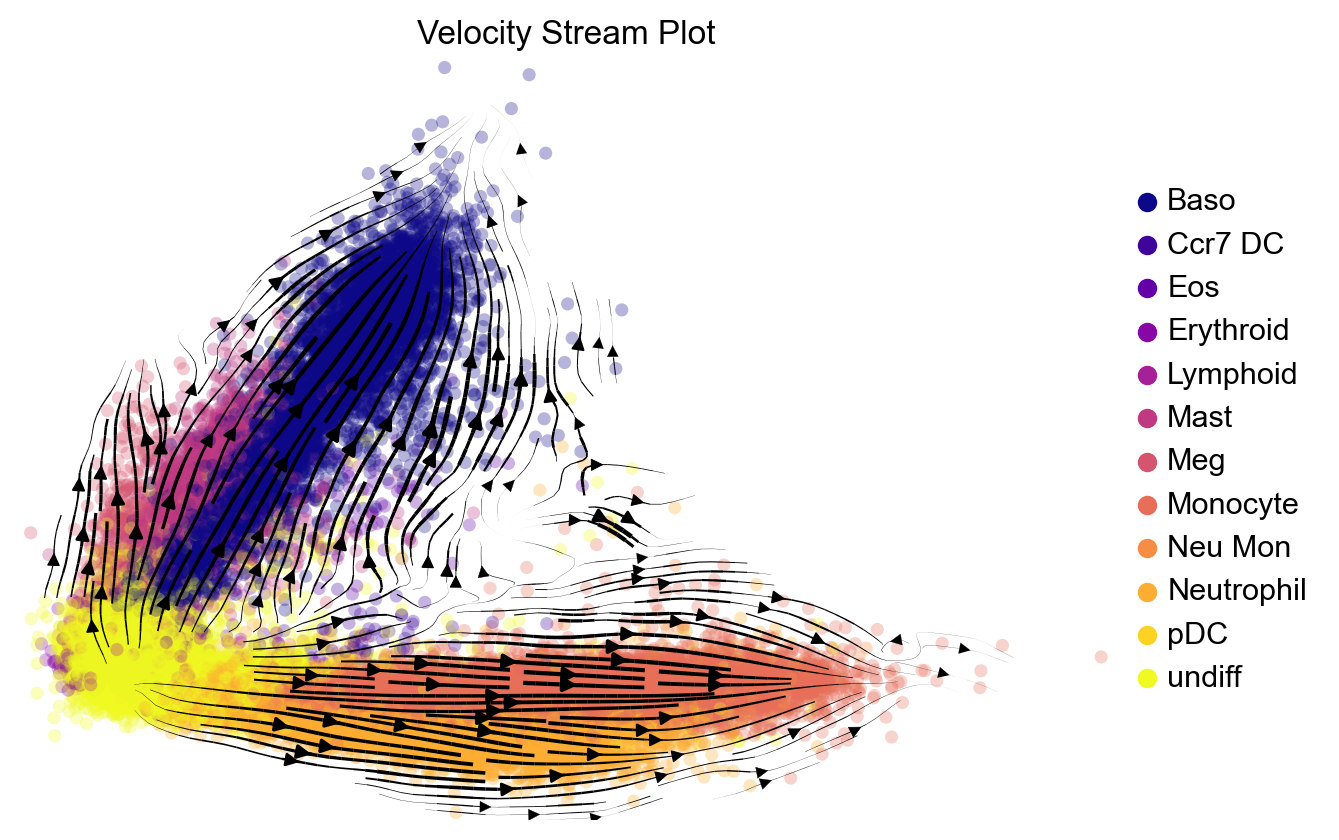
2.1 Plot Velocity stream
If the model includes velocity components, plot the velocity stream. (intrinsic velocity)
if 'velocity_latent' in adata.obsm:
    adata = cb.pl.plot_velocity_stream(adata, model,output_path, dim_reduction='umap', device='cuda',color_key="cluster")
computing velocity graph (using 16/64 cores)
    finished (0:00:21) --> added
    'velocity_graph', sparse matrix with cosine correlations (adata.uns)
computing velocity embedding
    finished (0:00:07) --> added
    'velocity_umap', embedded velocity vectors (adata.obsm)
saving figure to file /home/sjt/workspace2/CytoBridge_test-main_crufm/figures/results_cluster/scvelo_Velocity_Stream_Plot.svg
Velocity stream plot saved to: /home/sjt/workspace2/CytoBridge_test-main_crufm/figures/results_cluster/Velocity_Stream_Plot.svg
saving figure to file /home/sjt/workspace2/CytoBridge_test-main_crufm/figures/results_cluster/scvelo_Velocity_cluster_Stream_Plot.svg
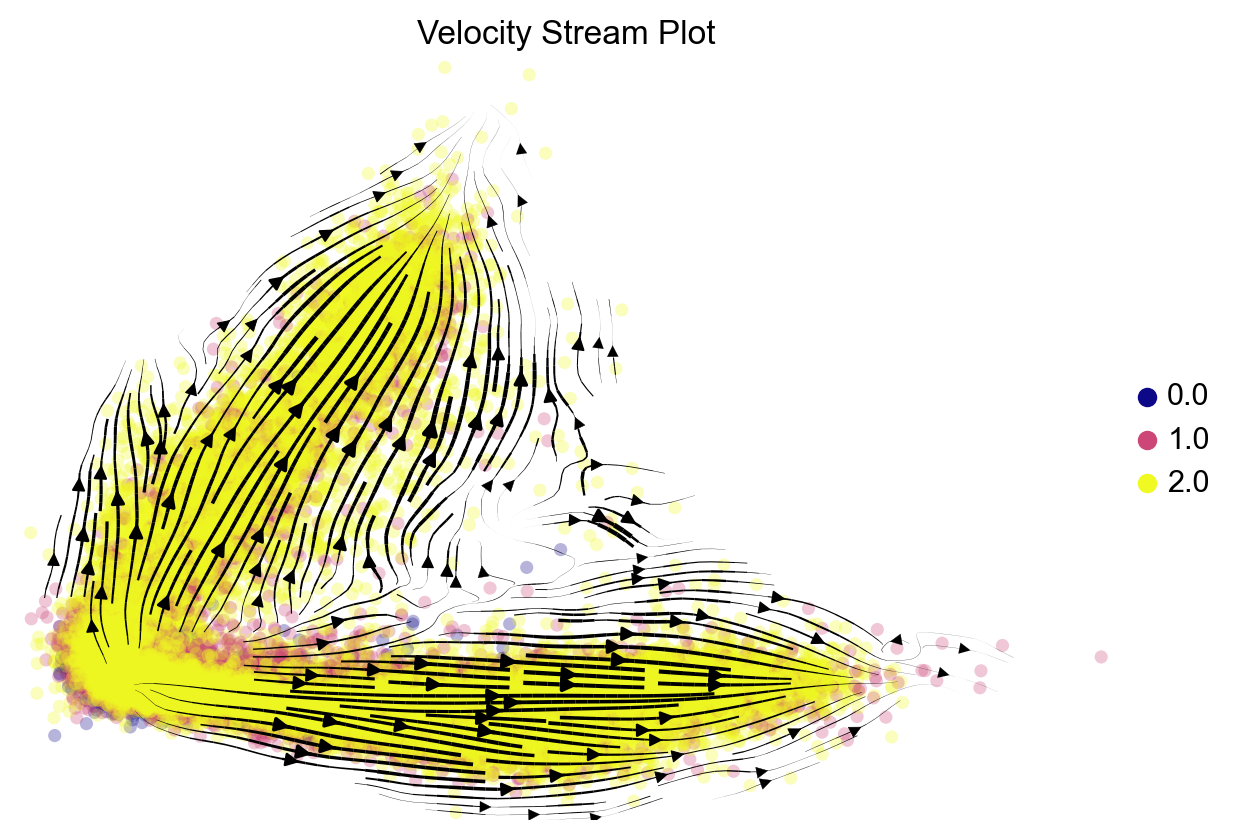
if 'velocity_latent' in adata.obsm:
    adata = cb.pl.plot_velocity_stream(adata, model,output_path, dim_reduction='none', device='cuda',color_key="cluster")
computing velocity graph (using 16/64 cores)
    finished (0:00:21) --> added
    'velocity_graph', sparse matrix with cosine correlations (adata.uns)
computing velocity embedding
    finished (0:00:07) --> added
    'velocity_umap', embedded velocity vectors (adata.obsm)
saving figure to file /home/sjt/workspace2/CytoBridge_test-main_crufm/figures/results_cluster/scvelo_Velocity_Stream_Plot.svg
Velocity stream plot saved to: /home/sjt/workspace2/CytoBridge_test-main_crufm/figures/results_cluster/Velocity_Stream_Plot.svg
saving figure to file /home/sjt/workspace2/CytoBridge_test-main_crufm/figures/results_cluster/scvelo_Velocity_cluster_Stream_Plot.svg
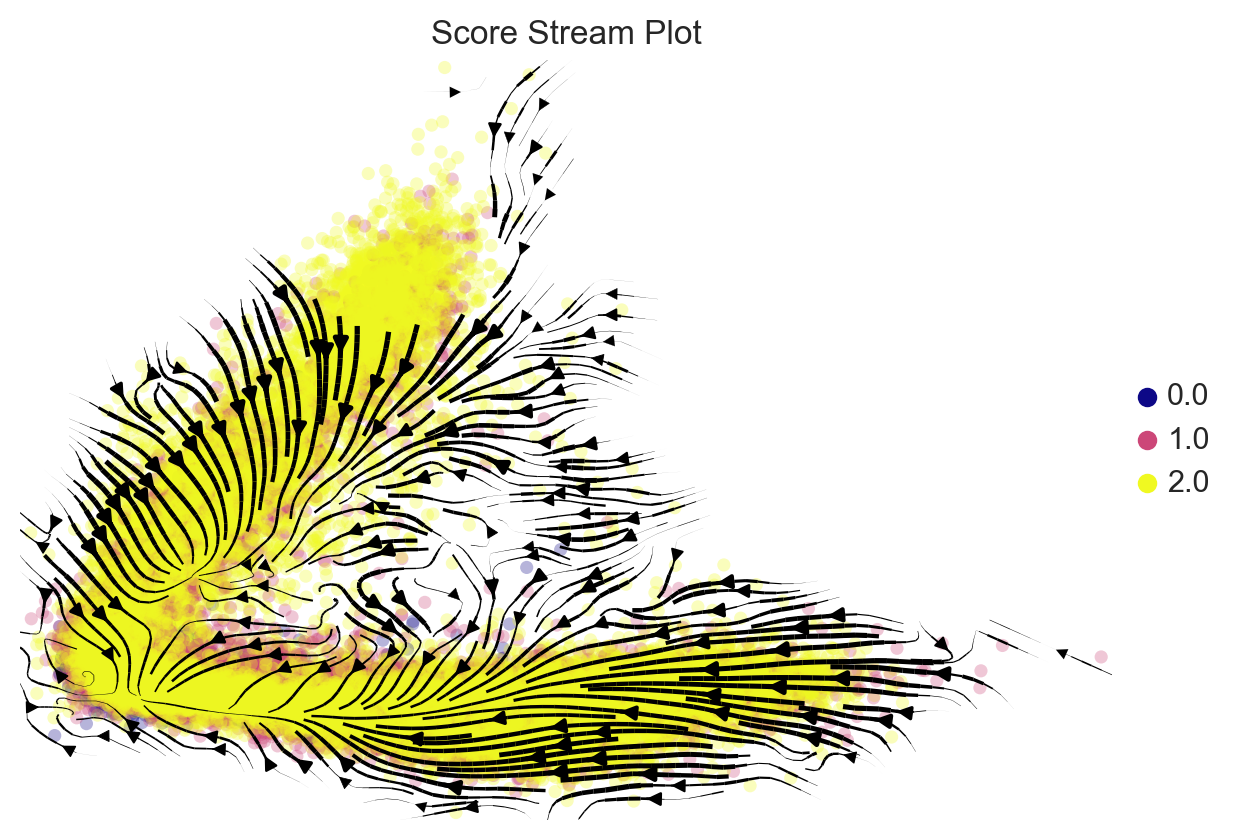
2.2 Plot Score Velocity
If the model includes Score components, plot the Score velocity stream. (diffusion velocity — Stochasticity)
if 'score_latent' in adata.obsm :
    cb.pl.plot_score_stream(adata,model, output_path, dim_reduction='none', device='cuda')
saving figure to file /home/sjt/workspace2/CytoBridge_test-main_crufm/figures/results_cluster/scvelo_Score_Stream_Plot.svg
Score function diffusion velocity stream plot saved to: /home/sjt/workspace2/CytoBridge_test-main_crufm/figures/results_cluster/Score_Stream_Plot.svg
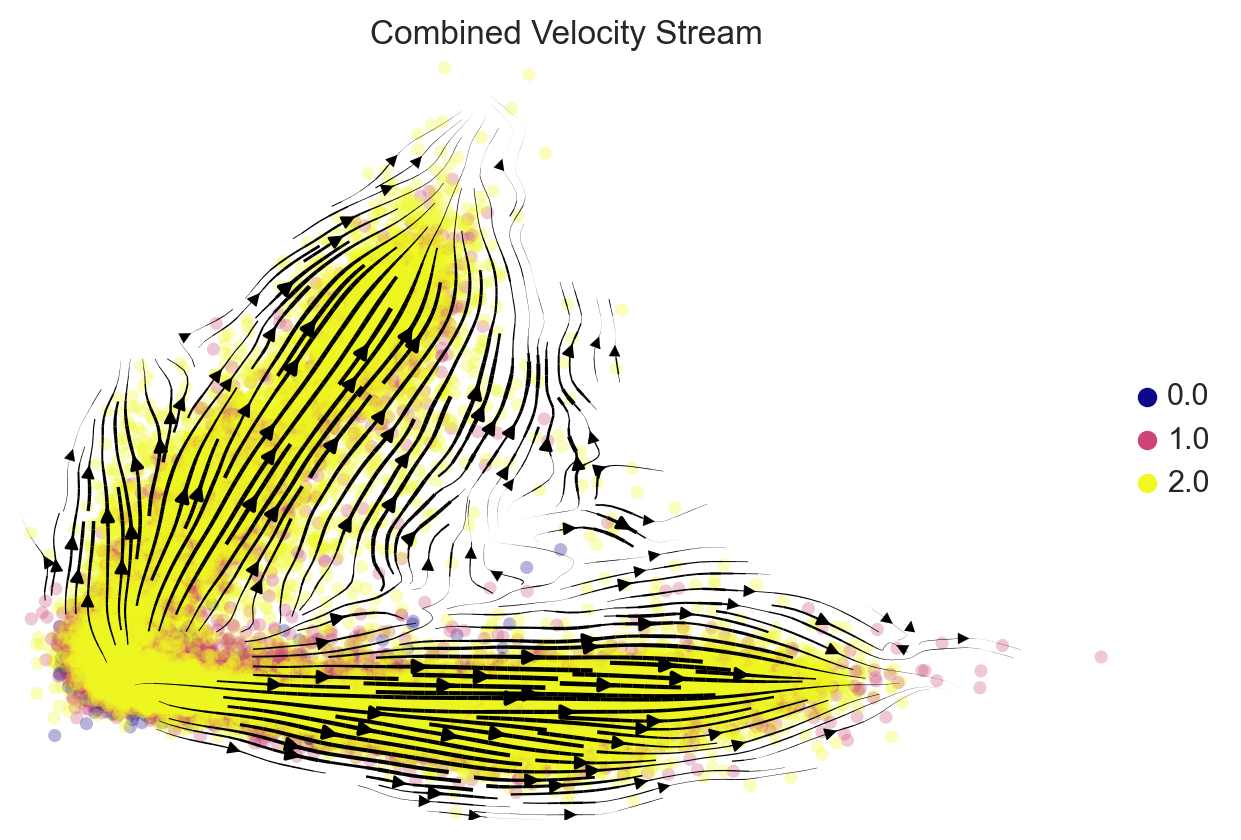
2.3 Plot All Velocity stream
If the model includes Velocity,Score components, plot All velocity stream.
if 'score_latent' in adata.obsm and 'velocity_latent' in adata.obsm:
    CytoBridge.pl.plot_combined_velocity_stream(adata,model,output_path,dim_reduction='none',device='cuda')
computing velocity graph (using 16/64 cores)
    finished (0:00:18) --> added
    'velocity_graph', sparse matrix with cosine correlations (adata.uns)
computing velocity embedding
    finished (0:00:07) --> added
    'velocity_umap', embedded velocity vectors (adata.obsm)
saving figure to file /home/sjt/workspace2/CytoBridge_test-main_crufm/figures/results_cluster/scvelo_All_Velocity_Stream.svg
All velocity stream plot saved to: /home/sjt/workspace2/CytoBridge_test-main_crufm/figures/results_cluster/All_Velocity_Stream.svg
3.Generating Unobserved Cellular Behaviors
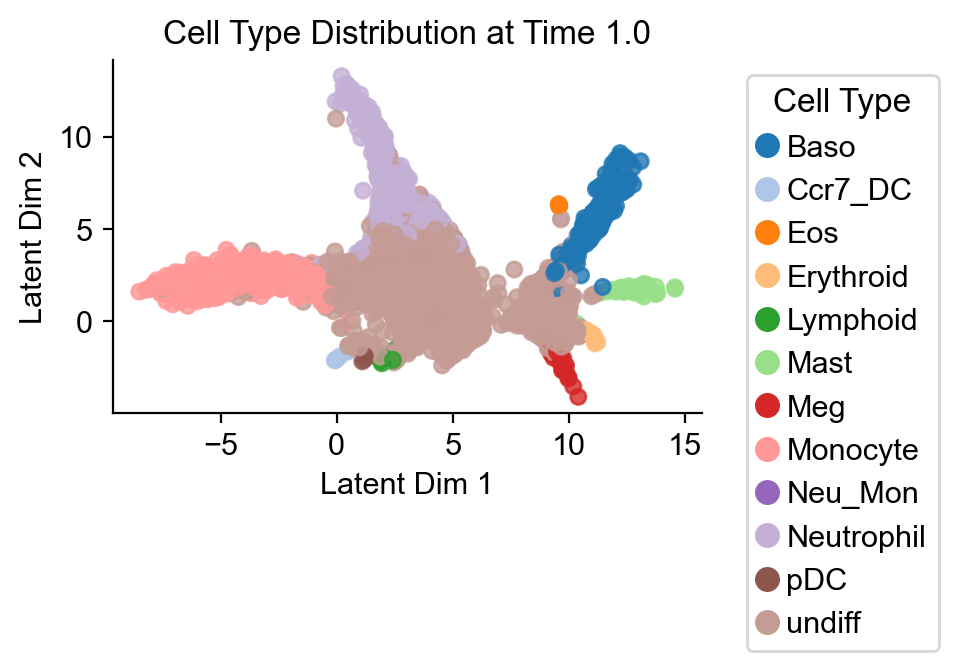
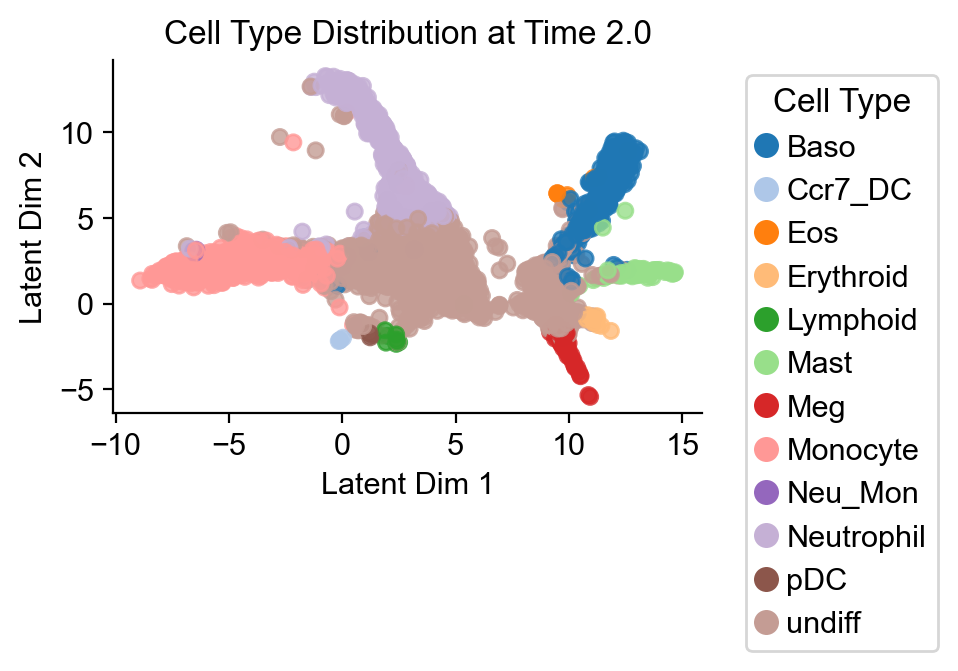
3.1 Generating Stochastic Trajectories via SDEs and classification
Generate the initial-data dynamics using a stochastic differential equation (SDE) model that incorporates both Velocity components and classify cells according to classifyed_type(cluster).
CytoBridge.pl.process_sde_classification(
    adata,
    model,
    classifyed_type= 'cluster',
    sde_data_path=output_path+'/sde_results',
    output_path = output_path+'/sde_results',
    n_time_steps = 10,
    sample_traj_num = 100,
    dim_reduction="umap",
    hidden_size=128,
    train_mlp_classifier_epoches=400
    )
Loading existing MLP classifier...
Loading SDE data...
Predicting cell types for SDE trajectories...
Visualizing results...
Results saved to /home/sjt/workspace2/CytoBridge_test-main_crufm/figures/results_cluster/sde_results
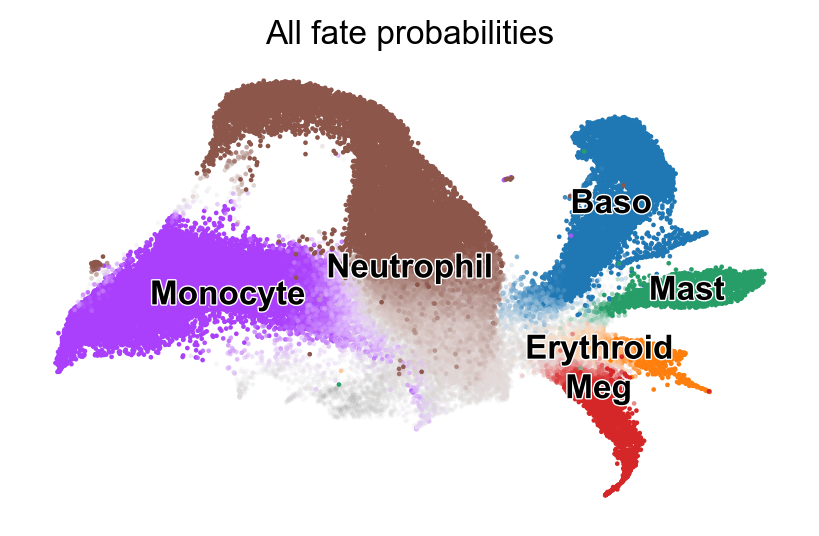
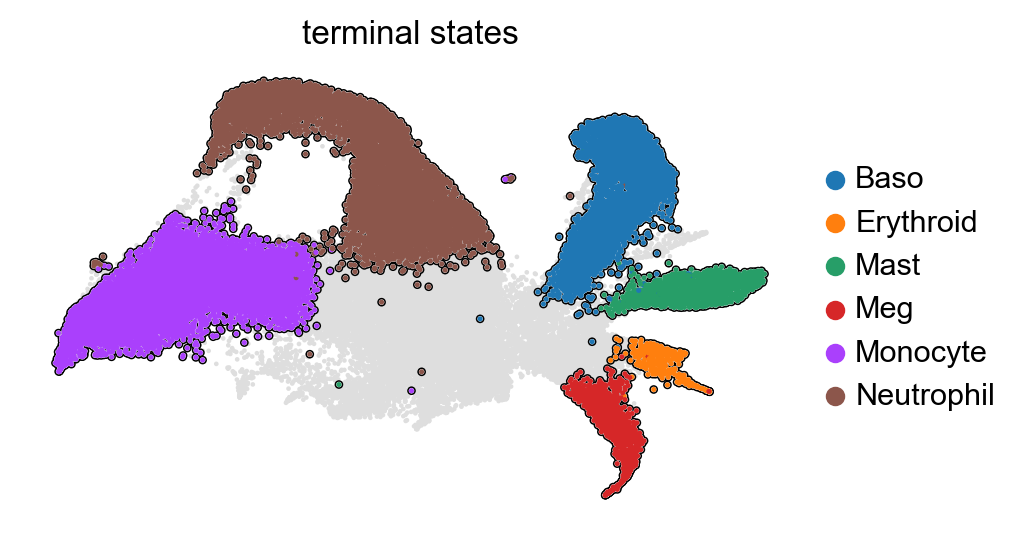
3.2 Plot Terminal States and Analyze Terminal States of Unterminal Cells
if 'velocity_latent' in adata.obsm:

    print(adata)
    CytoBridge.pl.analyze_terminal_states(adata, classified_type="cluster", terminal_states=["Neutrophil", "Monocyte","Mast","Erythroid","Baso","Meg"], output_path=output_path)
AnnData object with n_obs × n_vars = 49116 × 40
    obs: 'samples', 'cluster', 'time_point_processed', 'velocity_self_transition', 'time_categorical'
    uns: 'all_model', 'neighbors', 'time_categorical_colors', 'velocity_graph', 'velocity_graph_neg', 'velocity_params'
    obsm: 'X_latent', 'X_umap', 'growth_rate', 'score_latent', 'velocity_latent', 'velocity_umap'
    layers: 'Ms', 'velocity', 'velocity_latent'
    obsp: 'connectivities', 'distances'
/home/ubuntu/anaconda3/envs/DeepRUOTv2/lib/python3.10/site-packages/scvelo/plotting/scatter.py:656: UserWarning: No data for colormapping provided via 'c'. Parameters 'cmap' will be ignored
  smp = ax.scatter(
/home/ubuntu/anaconda3/envs/DeepRUOTv2/lib/python3.10/site-packages/scvelo/plotting/scatter.py:694: UserWarning: No data for colormapping provided via 'c'. Parameters 'cmap' will be ignored
  ax.scatter(
/home/ubuntu/anaconda3/envs/DeepRUOTv2/lib/python3.10/site-packages/scvelo/plotting/utils.py:1396: UserWarning: No data for colormapping provided via 'c'. Parameters 'cmap' will be ignored
  ax.scatter(x, y, s=bg_size, marker=".", c=bg_color, zorder=zord - 2, **kwargs)
/home/ubuntu/anaconda3/envs/DeepRUOTv2/lib/python3.10/site-packages/scvelo/plotting/utils.py:1397: UserWarning: No data for colormapping provided via 'c'. Parameters 'cmap' will be ignored
  ax.scatter(x, y, s=gp_size, marker=".", c=gp_color, zorder=zord - 1, **kwargs)
Terminal states analysis is saved to /home/sjt/workspace2/CytoBridge_test-main_crufm/figures/results_cluster
/home/ubuntu/anaconda3/envs/DeepRUOTv2/lib/python3.10/site-packages/scvelo/plotting/scatter.py:656: UserWarning: No data for colormapping provided via 'c'. Parameters 'cmap' will be ignored
  smp = ax.scatter(
/home/ubuntu/anaconda3/envs/DeepRUOTv2/lib/python3.10/site-packages/scvelo/plotting/scatter.py:656: UserWarning: No data for colormapping provided via 'c'. Parameters 'cmap' will be ignored
  smp = ax.scatter(
saving figure to file /home/sjt/workspace2/CytoBridge_test-main_crufm/figures/results_cluster/all_fate_probabilities_plot.svg