Simulation Dataset + Basic Plot
Note: The results presented are derived from simulated data, utilizing components of Velocity, Growth, Score, and Interaction.
import pandas as pd
import scanpy as sc
import numpy as np
from anndata import AnnData
import CytoBridge as cb
import os
1. Load Trained Data and Model
Load the trained data from the specified H5AD file and load the associated model.
save_path = "/home/sjt/workspace2/CytoBridge_test-main_crufm/results/cyexperiment_simulation/adata.h5ad"
exp_name      = os.path.basename(os.path.dirname(save_path))      # -> results_unscore
base_fig_dir  = "/home/sjt/workspace2/CytoBridge_test-main_crufm/figures"
output_path   = os.path.join(base_fig_dir, exp_name)
os.makedirs(output_path, exist_ok=True)


adata  = sc.read_h5ad(save_path)
model  = cb.utils.load_model_from_adata(adata)
device = "cuda"
Reconstructing model...
Model loaded successfully.
2.Dissecting Learned Dynamics on Observed Data
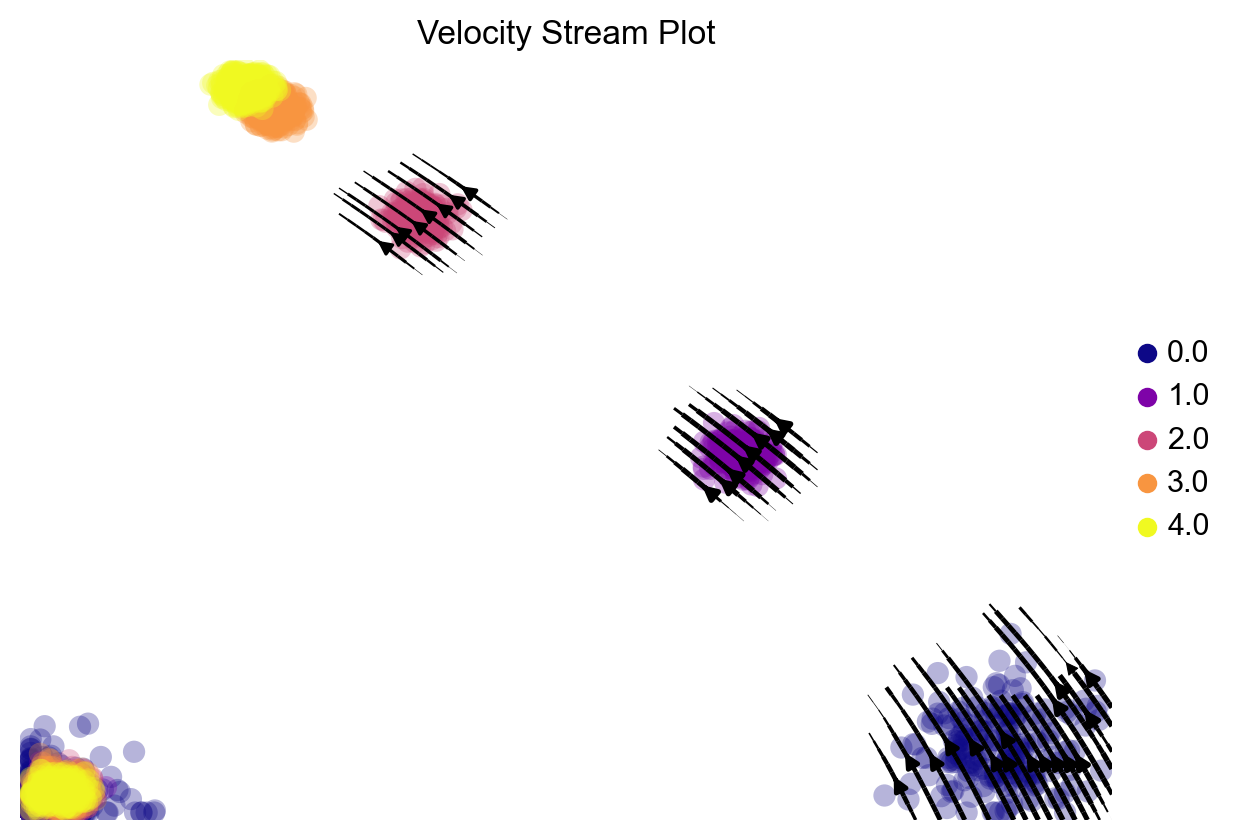
2.1 Plot Velocity stream
If the model includes velocity components, plot the velocity stream. (intrinsic velocity)
if 'velocity_latent' in adata.obsm:
    cb.pl.plot_velocity_stream(adata, model,output_path, dim_reduction='none', device='cuda')
saving figure to file /home/sjt/workspace2/CytoBridge_test-main_crufm/figures/cyexperiment_simulation/scvelo_Velocity_Stream_Plot.svg
Velocity stream plot saved to: /home/sjt/workspace2/CytoBridge_test-main_crufm/figures/cyexperiment_simulation/Velocity_Stream_Plot.svg
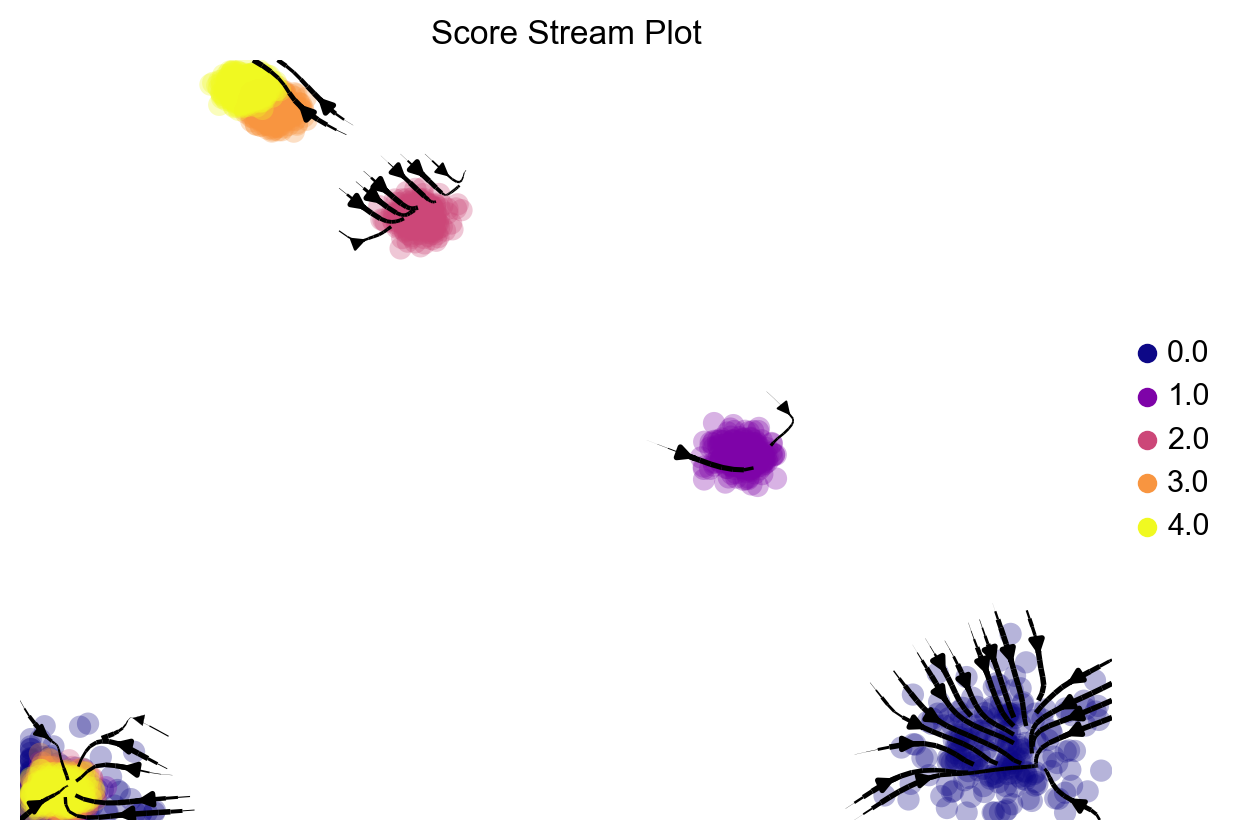
2.2 Plot Score Velocity
If the model includes Score components, plot the Score velocity stream. (diffusion velocity — Stochasticity)
if 'score_latent' in adata.obsm :
    cb.pl.plot_score_stream(adata,model, output_path, dim_reduction='none', device='cuda')
saving figure to file /home/sjt/workspace2/CytoBridge_test-main_crufm/figures/cyexperiment_simulation/scvelo_Score_Stream_Plot.svg
Score function diffusion velocity stream plot saved to: /home/sjt/workspace2/CytoBridge_test-main_crufm/figures/cyexperiment_simulation/Score_Stream_Plot.svg
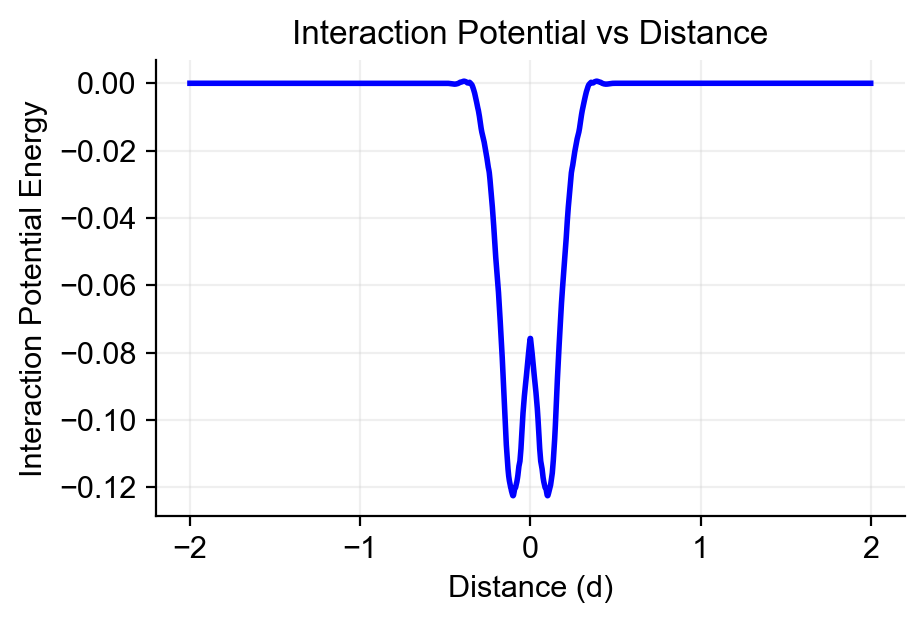
2.3 Plot Interaction Velocity
If the model includes interaction components, plot the interaction potential and interaction stream.
if "interaction" in adata.uns['all_model']['model_config']['components']:
    cb.pl.plot_interaction_stream(adata, output_path, dim_reduction='none', device='cuda')
    cb.pl.plot_interaction_potential(model, d=2, num_points=2000,output_path=os.path.join(output_path, "interaction_plot.png"))
Reconstructing model...
Model loaded successfully.
interaction_force use use_mass, True
saving figure to file /home/sjt/workspace2/CytoBridge_test-main_crufm/figures/cyexperiment_simulation/scvelo_Interaction_Force_Stream_Plot.svg
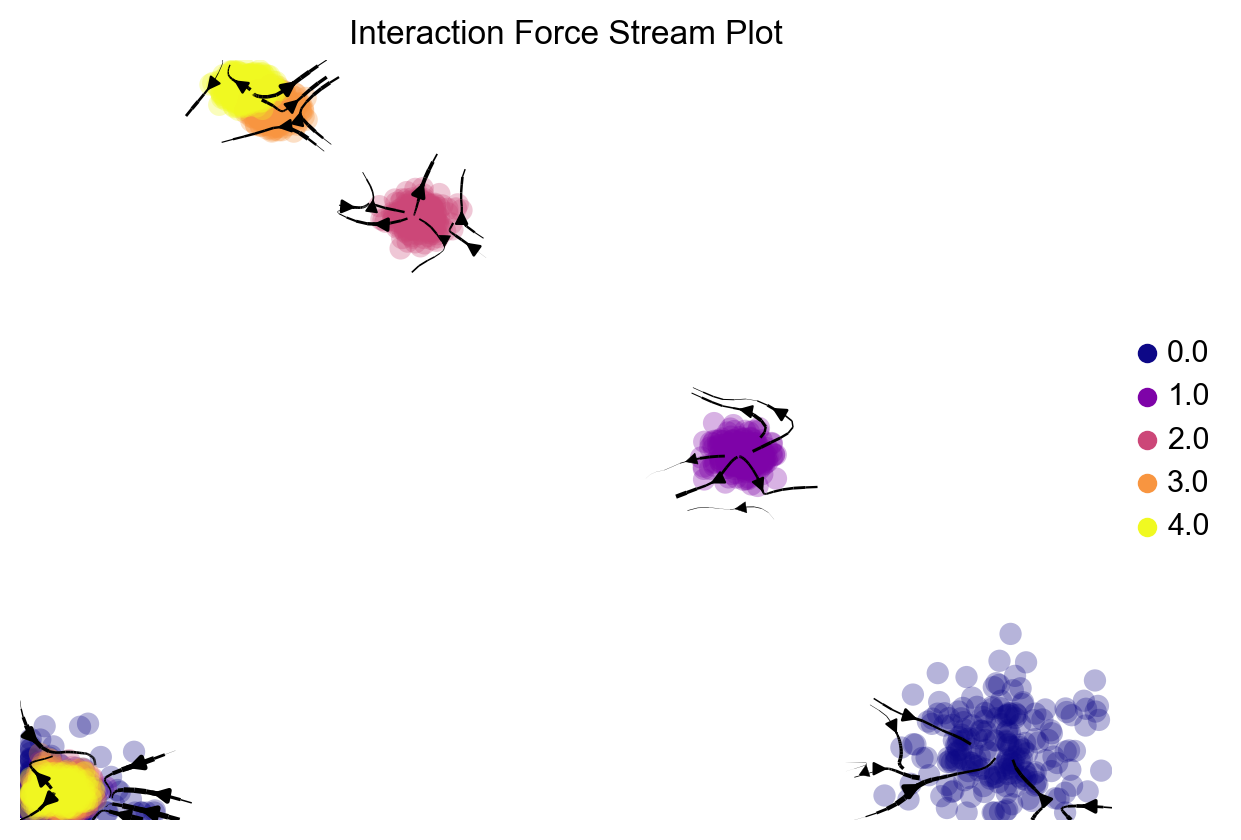
Interaction force stream plot saved to: /home/sjt/workspace2/CytoBridge_test-main_crufm/figures/cyexperiment_simulation/Interaction_Force_Stream_Plot.svg
[0. 0. 0. ... 0. 0. 0.]
Interaction potential plot saved to: /home/sjt/workspace2/CytoBridge_test-main_crufm/figures/cyexperiment_simulation/interaction_plot.png
2.4 Plot All Velocity stream
If the model includes Velocity,Score components, plot All velocity stream.
if 'score_latent' in adata.obsm and 'velocity_latent' in adata.obsm:
    cb.pl.plot_combined_velocity_stream(adata,model,output_path,dim_reduction='none',device='cuda')
/home/ubuntu/anaconda3/envs/DeepRUOTv2/lib/python3.10/site-packages/torch/autograd/graph.py:823: UserWarning: Attempting to run cuBLAS, but there was no current CUDA context! Attempting to set the primary context... (Triggered internally at /pytorch/aten/src/ATen/cuda/CublasHandlePool.cpp:180.)
  return Variable._execution_engine.run_backward(  # Calls into the C++ engine to run the backward pass
saving figure to file /home/sjt/workspace2/CytoBridge_test-main_crufm/figures/cyexperiment_simulation/scvelo_All_Velocity_Stream.svg
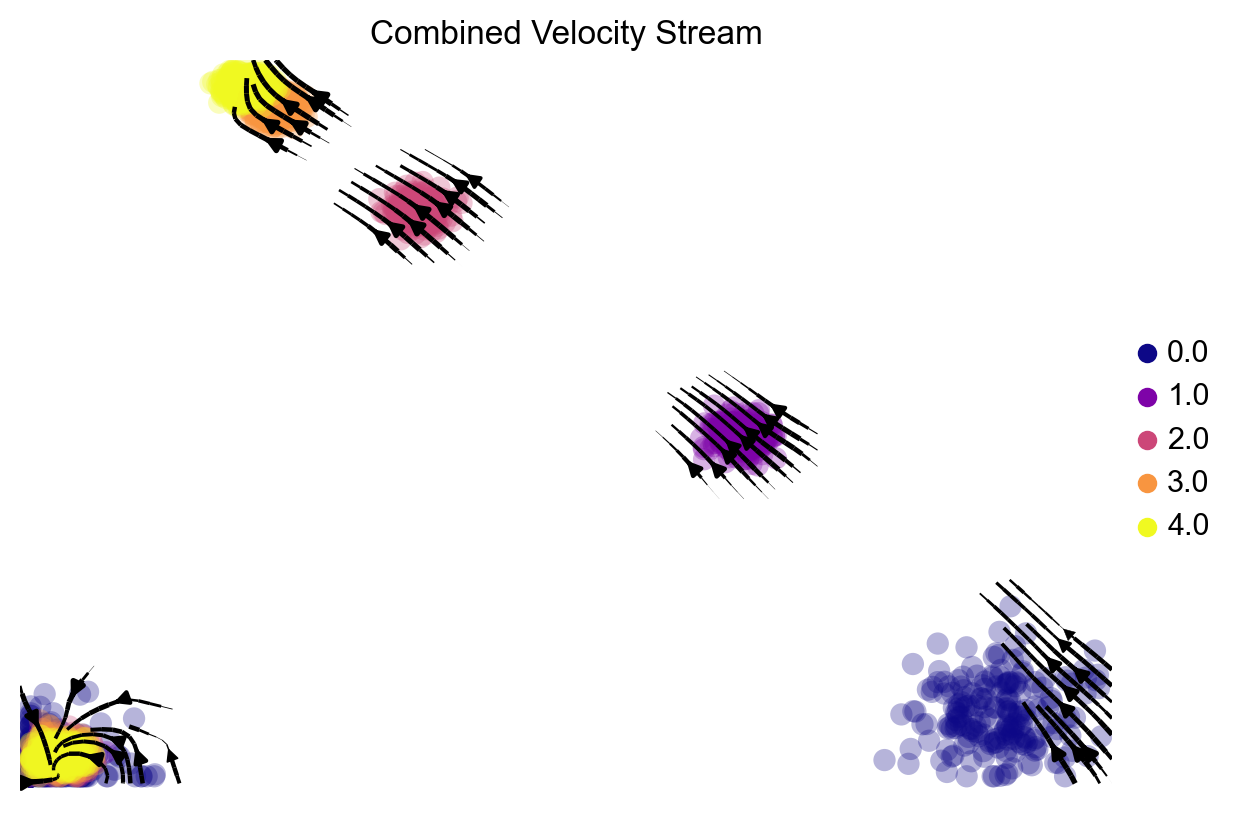
All velocity stream plot saved to: /home/sjt/workspace2/CytoBridge_test-main_crufm/figures/cyexperiment_simulation/All_Velocity_Stream.svg
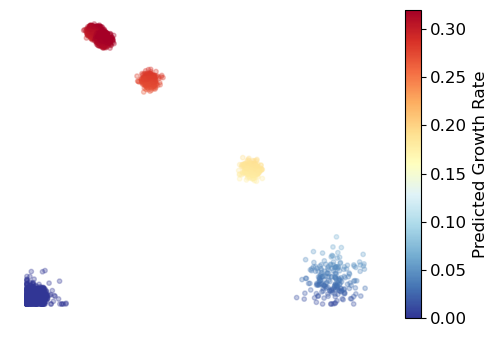
2.5 Plot Growth Rates
If the model includes Growth,Score components, visualize the growth rates of the data.
CytoBridge.pl.plot_growth(
    adata,
    dim_reduction='none',
    output_path=os.path.join(output_path, "g_values_plot.png")
)
[plot_growth] saved to -> /home/sjt/workspace2/CytoBridge_test-main_crufm/figures/cyexperiment_simulation/g_values_plot.png
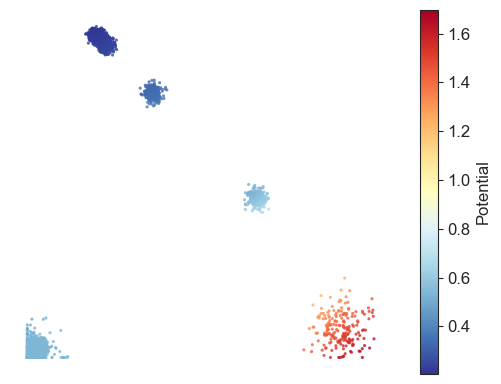
2.6 Plot Potential Landscape
If the model includes Velocity, Visualize the potential landscape of the data.
CytoBridge.pl.plot_landscape(adata,model,output_path=output_path,dim_reduction="none",device="cuda")
/home/ubuntu/anaconda3/envs/DeepRUOTv2/lib/python3.10/site-packages/torch/autograd/graph.py:823: UserWarning: Attempting to run cuBLAS, but there was no current CUDA context! Attempting to set the primary context... (Triggered internally at /pytorch/aten/src/ATen/cuda/CublasHandlePool.cpp:180.)
  return Variable._execution_engine.run_backward(  # Calls into the C++ engine to run the backward pass
Epoch 0, PotentialNet_loss: 0.136099
Epoch 500, PotentialNet_loss: 0.012659
Epoch 1000, PotentialNet_loss: 0.020549
Epoch 1500, PotentialNet_loss: 0.021196
3.Generating Unobserved Cellular Behaviors
3.1 Generating Deterministic Trajectories via ODEs
Generate the initial-data dynamics using a stochastic differential equation (SDE) model that incorporates both Velocity components.
CytoBridge.pl.plot_ode_trajectories(
    adata=adata,
    model=model,
    output_path=output_path,
    n_trajectories=20,
    n_bins=20,
    dim_reduction='none',
    device=device
)
/home/ubuntu/anaconda3/envs/DeepRUOTv2/lib/python3.10/site-packages/torch/autograd/graph.py:823: UserWarning: Attempting to run cuBLAS, but there was no current CUDA context! Attempting to set the primary context... (Triggered internally at /pytorch/aten/src/ATen/cuda/CublasHandlePool.cpp:180.)
  return Variable._execution_engine.run_backward(  # Calls into the C++ engine to run the backward pass
[generate_ode_trajectories] trajectories saved to /home/sjt/workspace2/CytoBridge_test-main_crufm/figures/cyexperiment_simulation/ode_results
[plot_ode_trajectories] saved to -> /home/sjt/workspace2/CytoBridge_test-main_crufm/figures/cyexperiment_simulation/ode_results/ode_trajectories.pdf
[ode_trajectories] done -> /home/sjt/workspace2/CytoBridge_test-main_crufm/figures/cyexperiment_simulation/ode_results/ode_trajectories.pdf
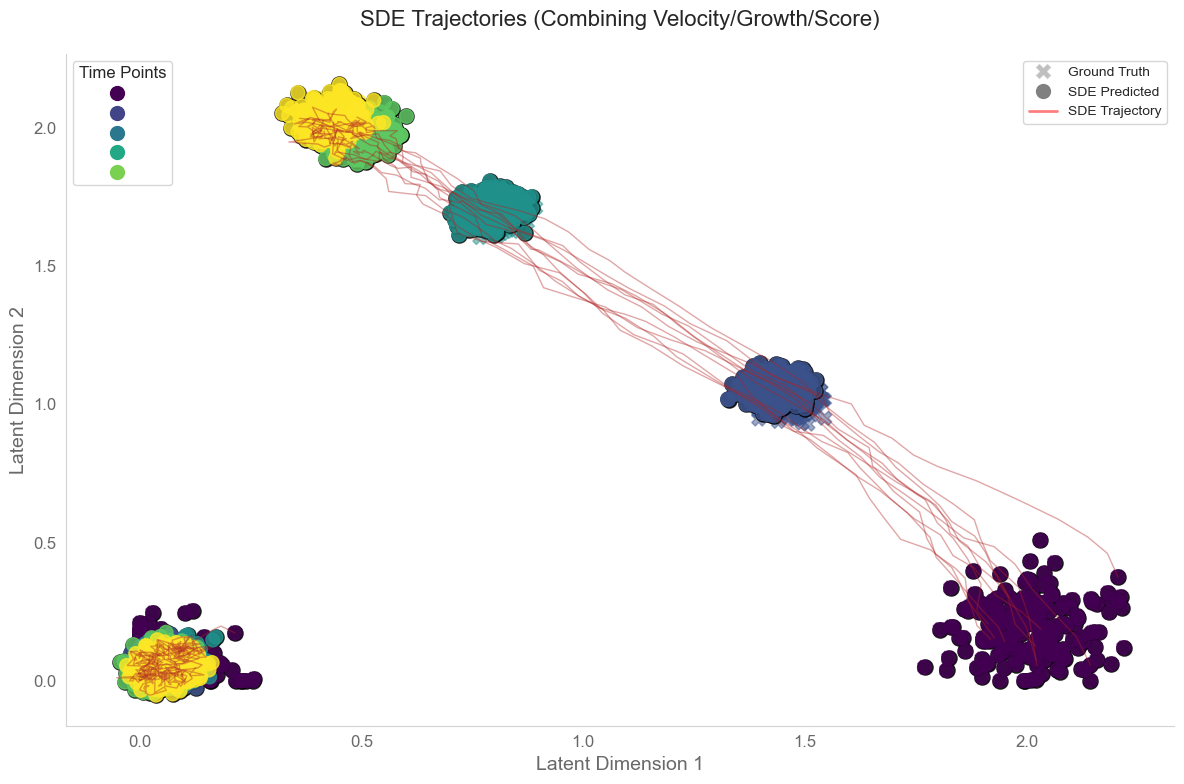
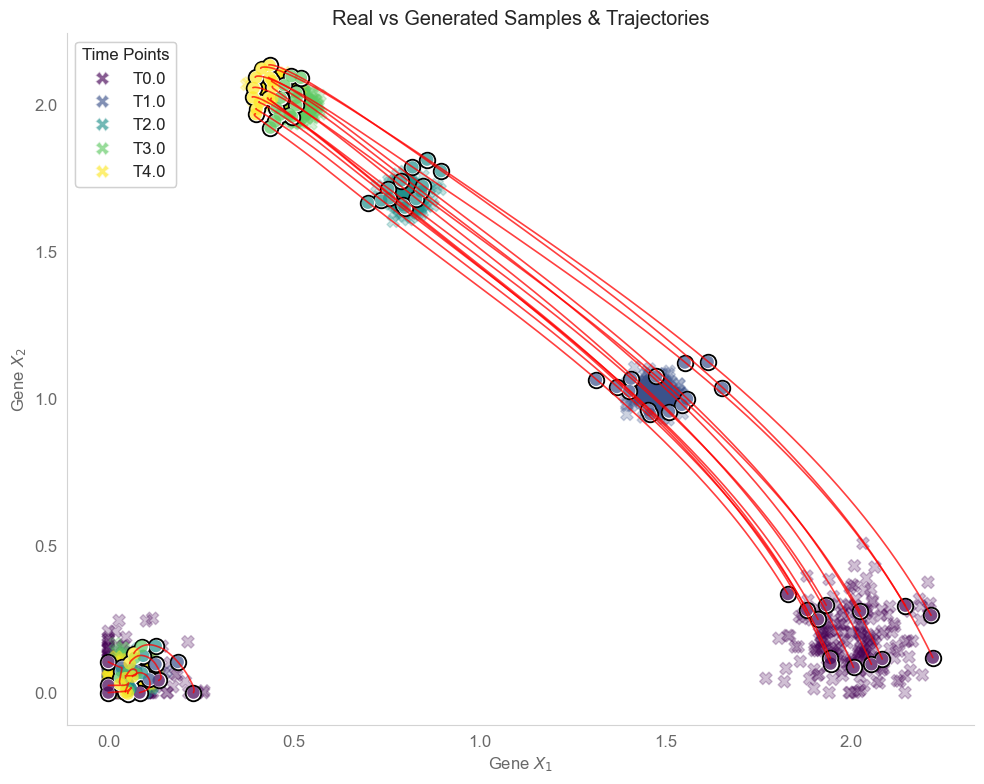
3.2 Generating Stochastic Trajectories via ODEs
Generate the initial-data dynamics using a stochastic differential equation (SDE) model that incorporates both velocity and score-based components.
adata = CytoBridge.pl.plot_sde_trajectories(
    adata=adata,
    output_path=os.path.join(output_path, "sde_results"),
    device=device,
    sigma=0.05,
    dim_reduction='none',
    n_trajectories=20,
    n_bins=50,
)
Using device: cuda
Loading model from adata...
Reconstructing model...
Model loaded successfully.
Model components: ['velocity' 'growth' 'score' 'interaction']
Plotting SDE trajectories...
SDE trajectory plot saved to: /home/sjt/workspace2/CytoBridge_test-main_crufm/figures/cyexperiment_simulation/sde_results/sde_trajectories.pdf